Taken from; Waldrop S.L., et al. J.Clin.Invest.
Vol.99. Number 7. 1997. 1739 - 1750.

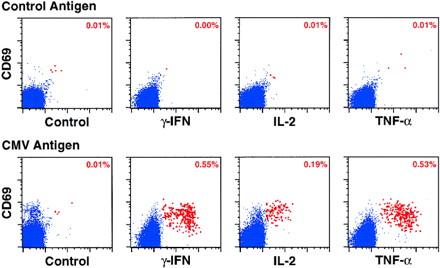
Fig. 1. Detection and characterization of CMV-specific CD4+ T cells by multiparameter flow cytometric detection of CMV Ag-induced CD69 upregulation and
cytokine synthesis. (A, top) Normal PBMC were stimulated with CMV Ag versus control Ag preparations for 6 h in the presence of the secretion inhibitor Brefeldin
A for the last 5 h, and examined as described in Methods for their correlated expression of intracellular cytokine (-IFN, IL-2, TNF- versus Control) versus the
activation antigen CD69 versus CD4. 48,000 events, gated on viable CD4+ lymphocytes, are shown in each plot. Events in the cytokine+, CD69+ "response" region
of the profiles are colored red (with the percentage of these cells given in the upper right hand corner), whereas events in the "nonresponding" region are colored blue.
The responses shown for control Ag (top) were identical to that observed in the absence of any added Ag (Brefeldin A alone). The experiment shown is
representative of > 10 independent experiments.